Navigating Apache Kafka Monitoring in Real-World Deployments
In this article we will discuss monitoring Apache Kafka in a production environment.
If you’re just starting to use Apache Kafka or maybe thinking about it (convincing you to start right away would require another post, but you should anyway), then probably monitoring it might have not even crossed your mind or seemed that important to you at the beginning.
However, as your cluster grows and you are dealing with an increasing number of different consumers, producers, connectors and constantly worrying about your Zookeeper cluster (although it was recently removed in the new release) then make yourself comfortable and keep reading; you’re in the right place!
Believe me when I tell you that this is actually a full time job and we are only going to scratch the surface. The rest is up to you.
That being said, this process could turn out to be very easy and more efficient by applying one of the existing solutions out there like the confluent control center which is part of the confluent platform. That’s awesome! Yet, I’m sure you already have guessed that it is not part of the community edition and you have of course to pay for it.
But, if you like to get your hands dirty and build your own monitoring solution using open source tools then let’s get started already.
All the source code is available here.
Contents
First let’s start with the basics.
What is Apache Kafka?
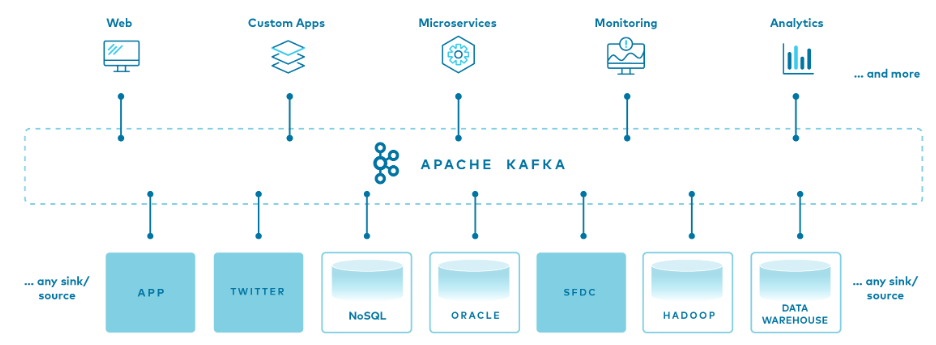
Apache Kafka is a distributed messaging queue system created by LinkedIn in 2011 and now an Open Source Project mainly maintained by Confluent the company founded by its original developers. It has then quickly evolved to a full-fledged event streaming platform.
It is based on a distributed, fault tolerant and resilient architecture. It allows decoupling of source systems, called Producers and target systems; the Consumers. Thus, not only simplifying the topology of your application but also handling millions of messages per seconds by horizontally scaling up to 100 brokers and still maintaining high performance and latency of less than 10ms making it widely adopted by many companies and the de facto platform for real time data processing.
What is Prometheus?
Prometheus is an open source monitoring and alerting toolkit. It is based on a pull model; collecting metrics from monitored targets and therefore alleviating them from a lot of workload.
Target systems make their metrics available by exposing an HTTP endpoint, usually /metrics. Prometheus then scrapes these endpoints at a regular interval to get the current state of values of the clients’ metrics and persists them to its time-series database.
In addition to the collected metrics, Prometheus will create an additional one called up, which will be set to 1 if the last scrape is successful, or 0 otherwise.
Most programming languages have a Prometheus client library that lets you define and expose internal metrics via an HTTP endpoint on your application’s instance. However, in the case when it is not feasible to instrument a given system with Prometheus metrics directly, exporters are the solution for you. In fact, there are a number of exporters which help in exporting metrics from third-party systems as Prometheus metrics. For example, the Prometheus Node Exporter exposes a wide variety of hardware- and kernel-related metrics.
Another example of exporters would be the JMX Exporter which we will discuss in details in the next section. In addition, we will also use a Kafka Exporter which is an open-source project that can be found here kafka_exporter for some Kafka cluster related metrics.
What is JMX-Exporter?
Java Management Extensions (JMX) is a Java technology that supplies tools for managing and monitoring applications. It is a common technology in Java for exporting statistics of running applications.
For instance Kafka brokers expose their metrics through JMX. Therefore, by using JMX Exporter which can export from a wide variety of JVM-based applications, we can automatically collect metrics from Kafka and exposes them over HTTP in a read-only mode for Prometheus.
This exporter is strongly encouraged to be run as a java agent running inside the same JVM of the target system even though it can be run as an independent HTTP server since the latter configuration comes with many disadvantages such as being harder to configure and being unable to expose process metrics (e.g., memory and CPU usage).
What is Grafana?
Grafana allows you to query, visualize, alert on and understand your metrics no matter where they are stored. Through the various visualizations options you’ll be able to not only create dashboards but also share them with the community and discover hundreds more off the shelf for you to be used. It supports dozens of data sources all in one place where you can correlate, explore, define alerts where it makes sense and foster a data driven culture.
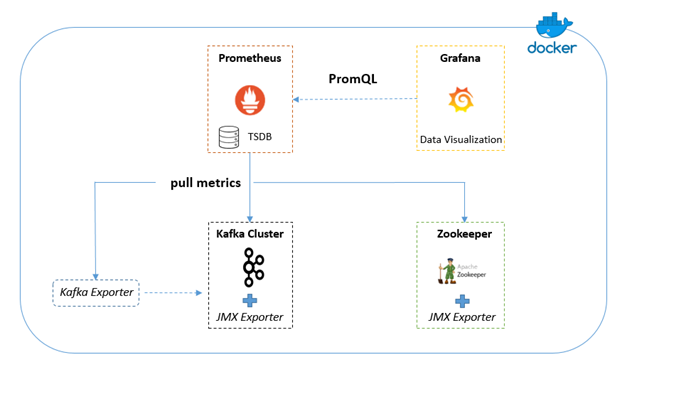
Now after looking at each component separately, the most important question is: how can we put all the above mentioned tools to create our monitoring platform?
Below is a diagram showing the different tools and the interactions between them:
Following are the main steps to set this topology up:
-
From jmx_exporter download JMX Exporter’s jar and configuration files for Kafka and Zookeeper respectively. These configuration files contain rules for rewriting JMX MBeans to the Prometheus exposition format metrics. Basically, it’s a collection of regexps to convert MBeans strings to Prometheus strings.
-
Add the following environment variable to each one of your Kafka nodes:
KAFKA_OPTS: -javaagent:/usr/jmx_prometheus_javaagent-0.10.jar=7071:/usr/prom-jmx-agent-kafka-config.yml- Add the following environment variable to your Zookeeper node:
JVMFLAGS: "-javaagent:/usr/jmx_prometheus_javaagent-0.10.jar=7000:/usr/prom-jmx-agent-zoo-config.yml"- Add the downloaded files to the corresponding containers and restart them.
- Start the Kafka Exporter Container by configuring the IP addresses or host names of your Kafka nodes:
command: "--kafka.server=kafka-1:9092 --kafka.server=kafka-2:9093 --kafka.server=kafka-3:9094"- Start Prometheus and Grafana with the provisioned dashboards.
- Log in to your Grafana instance and configure Prometheus as a data source. You should be able to see the several dashboards populated with a lot of metrics about your cluster.
With this we have reached the end of this post, I hope you enjoyed it!
An important aspect is yet to be covered in a separate follow up article which deals with the description and interpretation of the different metrics and the most important ones to keep an eye on and what are the appropriate actions to take in certain situations to keep a healthy running Kafka cluster.
Stay tuned!
Recap
In this article we discussed the building blocks and the interaction between them to set up an open source monitoring solution for a running Kafka cluster and ecosystem.
Happy learning!
Resources
https://www.confluent.io/what-is-apache-kafka