Essential Kafka Cluster Metrics: A Comprehensive Monitoring Guide
In this article we will stop by some of the most important metrics that we need to keep an eye on while monitoring an Apache Kafka cluster.
This is a follow-up article on the Kafka monitoring topic where we started by setting up the necessary infrastructure to monitor an Apache Kafka cluster running in a production environment.
If you have missed the first part, you can find it here.
The key metrics we are interested in can be grouped into the following categories:
- Broker Server Metrics
- Broker Topics Metrics
- Broker Requests Metrics
Contents
Broker Server Metrics
While it is important to collect and record the values of these metrics, an alerting mechanism needs to be put in place, in order to receive notifications mainly for the critical ones.
| Metric Name | Description | Alert |
|---|---|---|
| UnderReplicatedPartitions | Number of under-replicated partitions (ISR* < all replicas). Normal value 0. | Alert if value is greater than 0 |
| OfflinePartitionsCount | Number of partitions that don’t have an active leader and are hence not writable or readable. | Alert if value is greater than 0 |
| UnderMinIsr | Number of partitions whose ISR count is less than minIsr. Normal value 0. | - |
| LeaderElectionRateAndTimeMs | Leader election rate and latency. Non-zero when there are broker failures. | - |
| UncleanLeaderElectionsPerSec | Unclean leader election rate. Normal value 0. | Alert when value is different than 0 |
| PartitionCount | Number of partitions on this broker. This should be mostly even across all brokers. | - |
| LeaderCount | Number of leaders on this broker. This should be mostly even across all brokers. If not, set auto.leader.rebalance.enable to true on all brokers in the cluster. | - |
| MaxLag | Maximum lag in messages between the follower and leader replicas. This is controlled by the replica.lag.max.messages config. Lag should be proportional to the maximum batch size of a produce request. If a broker goes down, ISR for some of the partitions will shrink. When that broker is up again, ISR will be expanded once the replicas are fully caught up. Other than that, the expected value for both ISR shrink rate and expansion rate is 0. | - |
| IsrExpandsPerSec | When a broker is brought up after a failure, it starts catching up by reading from the leader. Once it is caught up, it gets added back to the ISR. | - |
| ConsumerLag | Lag in number of messages per follower replica. This is useful to know if the replica is slow or has stopped replicating from the leader. | - |
Table 1: Broker Server Metrics
*ISR: In-Sync Replica
Broker Topics Metrics
| Metric Name | Description |
|---|---|
| BytesInPerSec | Aggregate incoming byte in rate from clients. |
| BytesOutPerSec | Aggregate outgoing byte out rate from clients. |
| TotalProduceRequestsPerSec | Produce request rate. |
| FailedProduceRequestsPerSec | Produce request rate for requests that failed. |
| TotalFetchRequestsPerSec | Fetch request rate. |
| FailedFetchRequestsPerSec | Fetch request rate for requests that failed. |
Table 2: Broker Topics Metrics
Broker Requests Metrics
| Metric Name | Description |
|---|---|
| RequestQueueSize | Size of the request queue. A congested request queue will not be able to process incoming or outgoing requests. |
| TotalTimeMs | Total time in ms to serve the specified request broken into queue, local, remote and response send time. |
| RequestQueueTimeMs | Time the request waits in the request queue. |
| LocalTimeMs | Time the request is processed at the leader. |
| RemoteTimeMs | Time the request waits for the follower. This is non-zero for produce requests when acks=all. |
| ResponseQueueTimeMs | Time the request waits in the response queue. |
| ResponseSendTimeMs | Time to send the response. |
| PurgatorySize, delayedOperation=Produce | Number of requests waiting in the producer purgatory. This should be non-zero when acks=all is used on the producer. |
| PurgatorySize, delayedOperation=Fetch | Number of requests waiting in the fetch purgatory. This is high if consumers use a large value for fetch.wait.max.ms. |
Table 3: Broker Requests Metrics
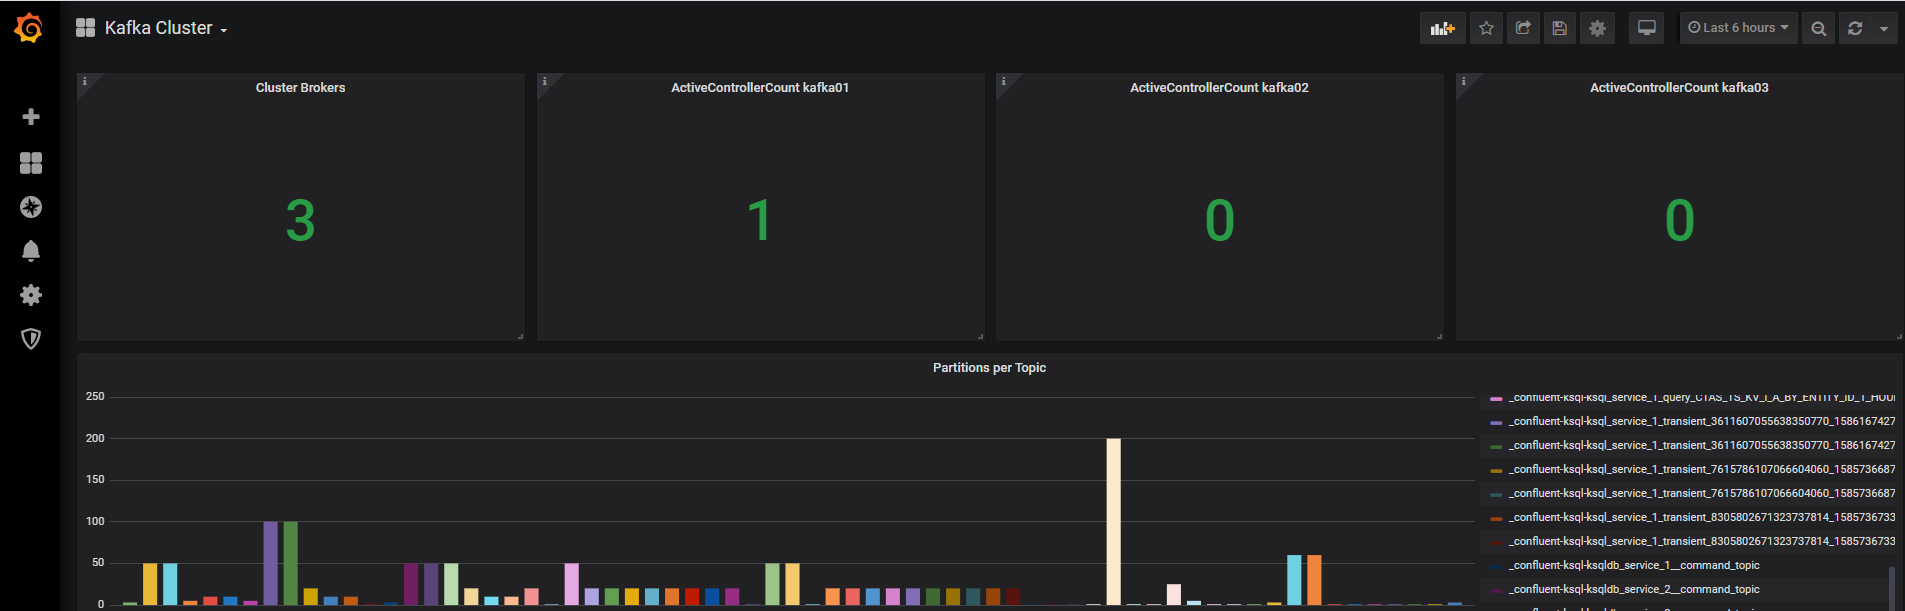
In this Github repository you can find a set of ready to use Grafana dashboards (see example below) populated with all the discussed above metrics that should serve as a starting point for you to quickly set up a tracking and alerting mechanism for your cluster.
With this we have reached the end of this post, I hope you enjoyed it!
The list of metrics mentioned here is not an exhaustive one and probably you will change or extend it depending on your use case and needs.
This is why it might be a good idea to check out the list of the resources below for a wider and more in-depth view especially if you’re looking for additional metrics related to other components like Zookeeper or your Consumers and Producers.
Recap
In this article we went through some of the most important metrics that we need to observe while monitoring an Apache Kafka cluster.
Happy learning!
Resources
https://docs.confluent.io/current/kafka/monitoring.html
https://blog.serverdensity.com/how-to-monitor-kafka/
https://www.datadoghq.com/blog/monitoring-kafka-performance-metrics/