Prometheus Monitoring: How to Collect and Analyze Metrics
In this article we will deep dive into prometheus, the open-source monitoring and alerting system, and see how we can use it to monitor a simple python application.
All the source code is available here.
So let’s get started!
Contents
- Introduction
- Collecting and Storing Metrics
- Integrating with Other Tools
- Implementation
- Recap
- Resources
Introduction
Prometheus is an open-source monitoring and alerting system. It is often used to monitor the performance of various systems and services, and can send alerts if certain thresholds are exceeded. Prometheus also has a powerful query language that can be used to analyze the data it collects.
Prometheus uses a pull model to collect metrics from targets. This means that Prometheus actively scrapes metrics from specified targets at regular intervals, rather than waiting for the targets to push metrics to it.
Prometheus Architecture
The main components of Prometheus are:
- Prometheus Server: This is the core component of Prometheus. It is responsible for scraping metrics from specified targets, storing metrics in its built-in time-series database, and processing and answering queries via PromQL.
- Target: A target is a system or service that Prometheus scrapes metrics from. Targets typically expose metrics in a specific format over HTTP, which Prometheus can understand.
- Time-Series Database: Prometheus stores all the metrics it collects in its built-in time-series database. This allows Prometheus to quickly query and analyze metrics, and to provide historical data.
- PromQL: Prometheus has a powerful query language called PromQL, which can be used to retrieve and analyze metrics stored in its database. PromQL allows you to filter and aggregate metrics, and to create complex queries and alerts.
- Alertmanager: Prometheus has a built-in alerting system called Alertmanager that can be used to trigger alerts based on metrics and send notifications through various channels.
- Exporters: Prometheus exporters are third-party tools that convert metrics from various systems and technologies into a format that Prometheus can understand. This allows Prometheus to scrape metrics from a wide variety of sources, such as JMX for Java applications, StatsD, SNMP, and more. For more details, check this blog post on how to use JMX exporter to monitor an apache kafka cluster.
These components work together in the following way:
The prometheus server scrapes metrics from specified targets, stores the metrics in its built-in time-series database, and uses PromQL to process and answer queries. The Alertmanager is used to trigger alerts based on metrics and send notifications. In addition, exporters can be used to convert metrics from various systems and technologies into a format that Prometheus can understand.
Collecting and Storing Metrics
Prometheus periodically scrapes metrics from specified targets, which are typically the applications or services that you want to monitor. These targets expose metrics in a specific format, usually over HTTP, that Prometheus can understand.
Prometheus supports several types of metrics:
- Counter: A cumulative metric that represents a single monotonically increasing counter whose value can only increase or be reset to zero on restart.
- Gauge: A metric that represents a single numerical value that can arbitrarily go up and down.
- Histogram: A metric that samples observations (usually things like request durations or response sizes) and counts them in configurable buckets. It also provides a sum of all observed values.
- Summary: Similar to a histogram, a summary samples observations and provides both the sum of all observed values and the number of observations.
- Untyped: A catch-all metric type that can be used to represent any sort of value.
- Vector: A collection of metrics with the same name and type, but with different labels. This allows users to aggregate and select time series based on their labels.
Prometheus also supports the concept of labels, which are key-value pairs that can be added to metrics to provide more context. Labels can be used to group and filter metrics, making it easy to identify trends and patterns in the data.
Integrating with Other Tools
There are several popular tools that can integrate with Prometheus:
- Grafana: A popular open-source visualization and dashboarding tool that can be used to create interactive and informative charts and graphs based on Prometheus metrics.
- Kapacitor: A data processing engine that can be used to perform calculations on Prometheus metrics in real-time, such as anomaly detection or aggregations.
- Thanos: A set of components that can be used to scale Prometheus and make it highly available, by providing features such as long-term storage and querying across multiple Prometheus instances.
Implementation
In our example, we created a simple python application using fastapi. Our application has two endpoints; one that returns the prometheus metrics and another one that returns a random fact about cats. When querying the latter, we also show how to create your own prometheus metrics by measuring the number of times our endpoint was triggered. This is an example of a metric of type counter.
Set up
1- Clone this Github repository, change into the corresponding directory and run the following command: docker-compose up -d
This will start two docker containers: one corresponding to the prometheus service and the other is our python application container called fastapi-app.
2- Access the prometheus dashboard in your web browser through: http://localhost:9090/targets where you will see our python application as a target for the prometheus service to monitor as shown in the screenshot below:

3- Go to http://127.0.0.1:8000/docs where you will see the Swagger UI of our python application.
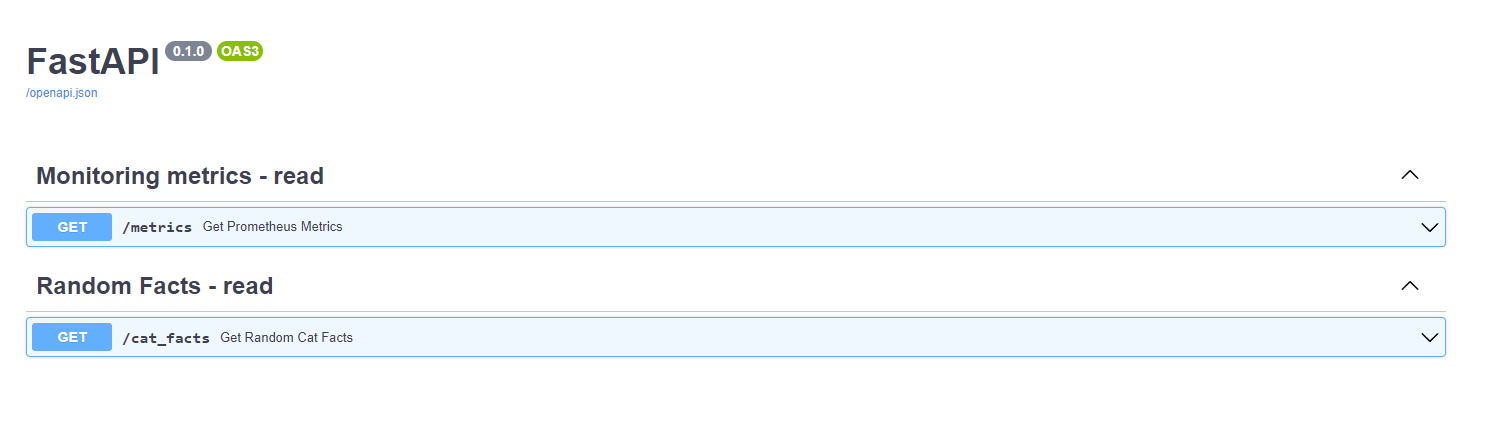
As indicated in the screenshot above, our application has two endpoints:
-
/metrics: Makes the monitoring metrics available for prometheus to scrape -
/cat_facts: Returns a random fact about cats.
As mentioned when triggering the last endpoint, we calculate in the background a prometheus metric called: random_facts_api_execution_counter which measures the number of times this endpoint was triggered.
When we request the /metrics endpoint, we see a list of metrics measuring several things such as the request time, python garbage collection objects, etc…
These metrics were made available by adding the prometheus middleware to our application. In addition, we can also see our own created metric as shown below:

That’s it! You have successfully created a custom metric in your python application and you were able to scrape it and make it visible to prometheus.
With this we have reached the end of this post, I hope you enjoyed it!
Recap
In this blog post, we discussed Prometheus monitoring, a widely used and powerful monitoring and alerting system. We covered topics such as Prometheus architecture, how to collect the different types of metrics and gave an example of popular tools that can integrate with Prometheus. In addition, we went through an example of how to deploy a python application in which we created a custom metric and we were able to scrap it and visualize it using prometheus.
Happy learning!
Resources
https://prometheus.io/docs/introduction/overview/
https://docs.influxdata.com/kapacitor/v1.6/working/scraping-and-discovery/